scale_color_gradient2
ARGUMENTS
no arguments
without the scale
labels
guide
breaks
n.breaks
name
low, mid, high
trans
na.value
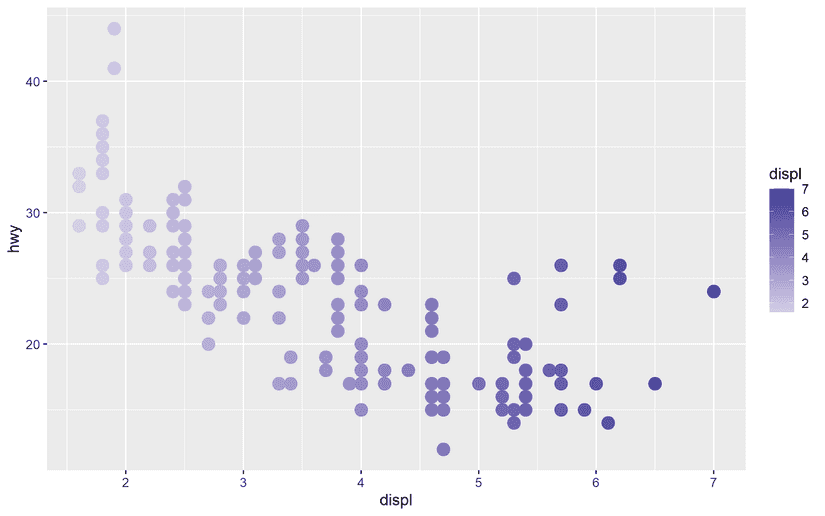
ggplot(mpg, aes(x = displ, y = hwy, color = displ)) +
  geom_point(size = 4) +
  scale_color_gradient2()
ggplot2tor
Tutorials, educational apps, cheat sheets and courses for you to master ggplot2
Creator and author
I am an Instructional Designer and a former educational scientist with a curiosity for web development and data visualization. Find me on my personal homepage or LinkedIn.
