scale_fill_manual
ARGUMENTS
no arguments
without the scale
drop
na.translate
guide
na.value
values
breaks
labels
name
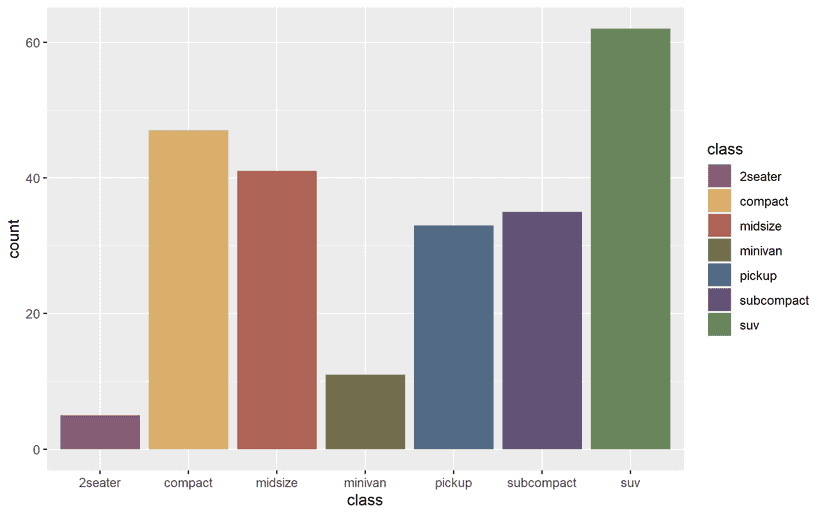
ggplot(mpg, aes(x = class, fill = class)) +
  geom_bar() +
    scale_fill_manual(values = c('#855C75', '#D9AF6B', '#AF6458', '#736F4C', '#526A83', '#625377', '#68855C'))
ggplot2tor
Tutorials, educational apps, cheat sheets and courses for you to master ggplot2
Creator and author
I am an Instructional Designer and a former educational scientist with a curiosity for web development and data visualization. Find me on my personal homepage or LinkedIn.
